Data extraction - Univariate Calibration
In this step of the calibration, a suitable evaluation model and corresponding spectral ranges or intensities must be adjusted before proceeding to the next step. This dialog is also used to define new data extraction methods.
Please follow the instructions below to adjust suitable parameters for calibration.
Selecting a suitable data extraction method
Use the drop down box on the left side of the dialog to select a data extraction method. Individual parameters will be shown on the right side accordingly. Depending on the selected method, you might also choose some parameters graphically in the spectrum area. The following extraction methods are available:
Formula
This evaluation allows you to enter an individual formula for calculating the value of a physical property from spectral data. All intensity values, peak heights or peak areas might be addressed in a custom formula for calculation of the property value from spectral data. To enter a valid formula, please click the ![]() icon on the right side of the Formula field. A formula editor will be opened.
icon on the right side of the Formula field. A formula editor will be opened.
The calibration formula editor looks like this:
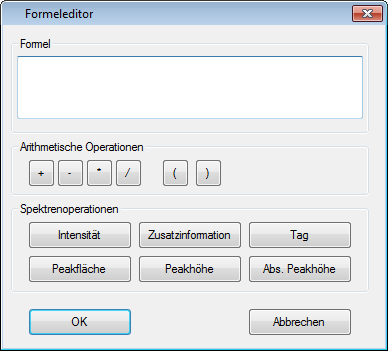
Enter any formula using simple arithmetic mathematic operations into the text field. If you are not sure about the syntax, please use the short hand buttons underneath the text field or the context menu available on right mouse button click for assistance.
Context menu
To open the context menu, holding all functions listed below, please follow the instructions below:
-
Move the mouse pointer to the position in the text field, where you like to insert a parameter, operator, mathematical function or label.
-
Click the Right Mouse button to open the context menu.
-
From any sub-menu, select the desired command.
Formula parameters
The following values, variables, mathematical functions and operators are allowed to create a formula:
Values
- Positive or negative numeric values
Spectral Operations
-
Intensity values at a defined position on the x-axis of the current set of calibration spectra. For assistance, please click the Intensity button.
-
Peak area of a defined peak position within the current set of calibration spectra. A peak will be defined by a starting and an ending position on the x-axis. The peak area will be calculated as the area between the baseline of the peak and the graph of the spectrum. The baseline of the peak is meant to be a straight line between starting and ending point of the peak. For assistance, please click the Peak Area button.
-
Peak height of a defined peak position within the current set of calibration spectra. A peak will be defined by a starting and an ending position on the x-axis. The peak height is determined from the maximum intensity value within the peak range with respect to the baseline of the peak. The baseline of the peak is meant to be a straight line between starting and ending point of the peak. For assistance, please click the Peak Height button.
-
Tags are defined variables for a given spectrum. Available tags are the minimum and maximum data values for the x-axis and y-axis.
Mathematical functions
Default mathematical functions from a pocket calculator like sin(x), cos(x), tan(x), sqrt(x), sqr(x), etc. are available in the context menu of the editor.
Operators
A list of operators is given as buttons below the formula text field. They are also available in a context menu.
-
Any basic mathematical operators are allowed to add, subtract, multiply or divide values. For assistance, please click one of the operator buttons.
-
Mathematical terms can be put in parentheses to control the order of calculation.
Example:
The ratio between the intensity at a desired x-axis value and the height of the underlying peak in this area must be evaluated. Spectral data needs to be corrected by a dilution factor, which has been retrieved in previous "wet chemistry" analysis. The dilution factor was attached to the data objects in a label called "Dilution Factor" and can be used in the formula now.
Intensity[ 612 ] / Peak Height[ 580; 690 ] * Label[ Dilution Factor ]
Intensity
This evaluation allows the user to address a particular x-axis position in the calibration spectra. The intensity values at the defined position will be taken into account for calculation of the calibration model.
To select a particular position for evaluation, either enter a spectral value into the Position field on the right or move the green vertical line in the data view to the desired position. Moving the line is performed by drag & drop with the mouse.
Intensity Ratio
This evaluation allows to calculate the ratio of two intensity values at particular positions on the x-axis. The result of the intensity ratio calculation is used for calibration of the desired property.
To select the position in the spectrum, which is used as nominator, please enter a value into the Nominator field or move the left green vertical line to any desired position in the data view.
To select the position in the spectrum, which is used as denominator, please enter a value into the Denominator field or move the right green vertical line to any desired position in the data view.
Peak
This evaluation model considers a user defined spectral range, whereby either the maximum discovered peak height in this range or the peak area in this range are used for evaluation of the property in the calibration.
When using the peak area model, integration will be carried out among all intensity values in the selected range down to zero. Neither the starting and ending positions of a real peak (as known from peak finding) nor the baseline of the peak are considered.
Only the absolute starting and ending positions are used. This might result in problems if peaks are slightly shifting along the x-axis!
First, select the Peak Evaluation Mode from the drop down box. The following modes are available:
-
Height
In the specified spectral range, the maximum intensity is used for evaluation in the calibration. -
Absolute Height
The absolute height of the selected spectral range is extracted. -
Area
In the specified spectral range, the area underneath the spectrum graph down to zero is taken into account for calibration.
Secondly, the starting and ending position of the spectral range must be adjusted. Either enter valid x-axis values into the From and To text fields on the right, or move and expand the displayed green area within the data view with the mouse.
Peak Ratio
This extraction method considers the ratio of to peak areas. Two peak areas have to be defined with the same options as in the Peak method and have to be assigned to the nominator and denominator.