Reaction Window Overview
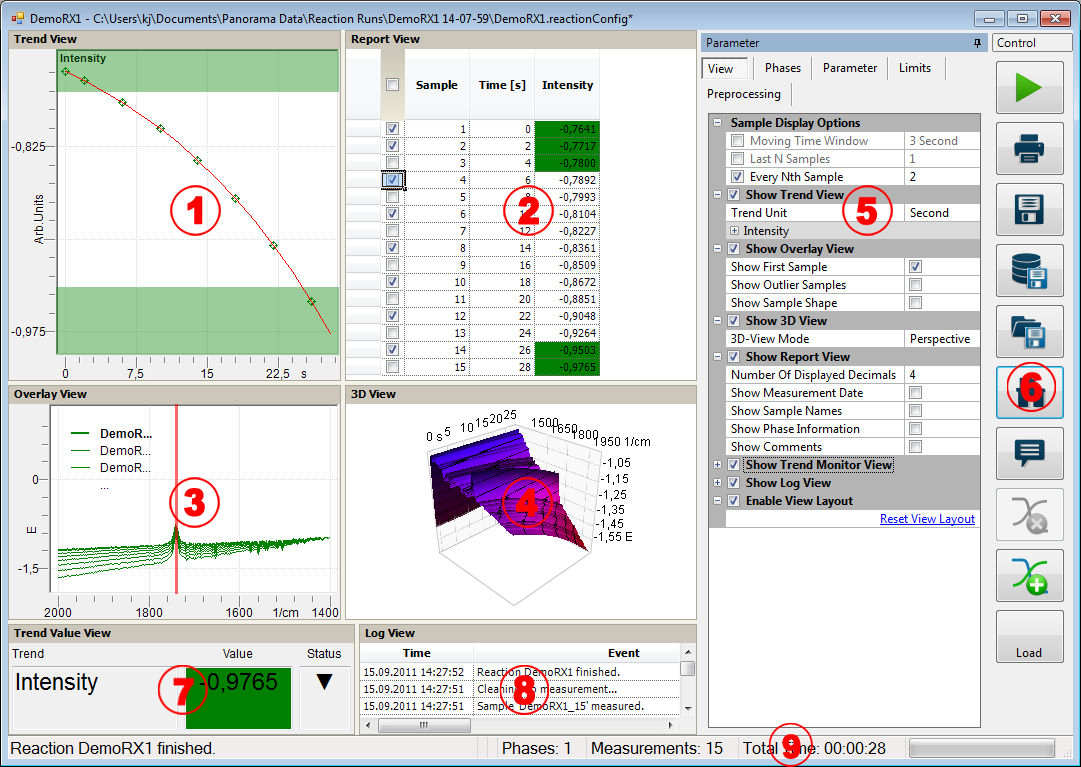
The reaction window is the main user interface for the actual reaction monitoring run. The reaction windows is opened by selecting a reaction in the menu entries Run Reaction or Process Reaction with active Spectra. The reaction window looks like this:
Reaction Window Contents
1. Trend View
The trend view shows a plot of the data that is being extracted from the spectra during the reaction run. Options for the trend view may be adjusted via the context menu by clicking the Right Mouse button or by the parameter panel (5) on the right side. A detailed description of the display and configuration options can be found in the section Trend View.
2. Report View
The report view shows the numerical data of the reaction run in form of a data table. The table will also show information about the current reaction phase and the limits and batches that have been added. It also enables the user to select a certain range or group of samples to be displayed in the other views. Additional data columns and other options for the grid view may be adjusted using the parameter panel (5). A detailed description of the display and configuration options can be found in the section Report View.
3. Overlay View
The overlay view shows a simple two-dimensional overlay of the sample spectra that are acquired during the reaction run. Either all spectra may be shown or only certain samples may be selected in the report grid view (2). Spectra can be transferred directly to the main application by using the Right Mouse button context menu. Options for the overlay view may be adjusted in the parameter pane (5). A detailed description of the display and configuration options can be found in the section Overlay-View.
4. 3D-View
The 3D-View shows a three-dimensional representation of the sample spectra that are acquired during the reaction run. A detailed description of the display and configuration options can be found in the section 3D-View.
5. Parameter Panel
The parameter panel shows a tabbed overview of all parameters. In addition to the view options information about the phases, instrument parameters, limits and preprocessing is shown and may also be edited. The parameter panel can be undocked from the reaction window. A detailed description of the parameter panel can be found in the section Parameter Panel.
6. Control Panel
The control panel shows the main control buttons for the reaction window. These include general controls (print, exit, save etc.) as well as special controls (add limit, add preprocessing, add golden batch etc.) depending on the tab that is selected in the parameter pane. A detailed description of the parameter pane can be found in the section Control Panel.
7. Trend Monitor View
If activated this large numerical representation of the trend evaluation will be shown. Useful for monitoring the trend values from a greater distance to the computer display. A detailed description of the monitor view can be found in the section Trend Monitor View.
8. Reaction Log
If activated an event list for the current reaction will be shown.
9. Status Bar
The status bar at the bottom of the reaction view shows real time information about the reaction run and the current status. This includes current measurement information and information about the current phases, the elapsed and remaining time and the already measured and remaining samples.