Spectrum Measurement Window
The spectrum measurement window is embedded into the main application window. All measurement parameters can be adjusted in the instrument tab on the right. It slides in and out on demand. Measured data will be displayed in regular data views (2D-view/3D-view).
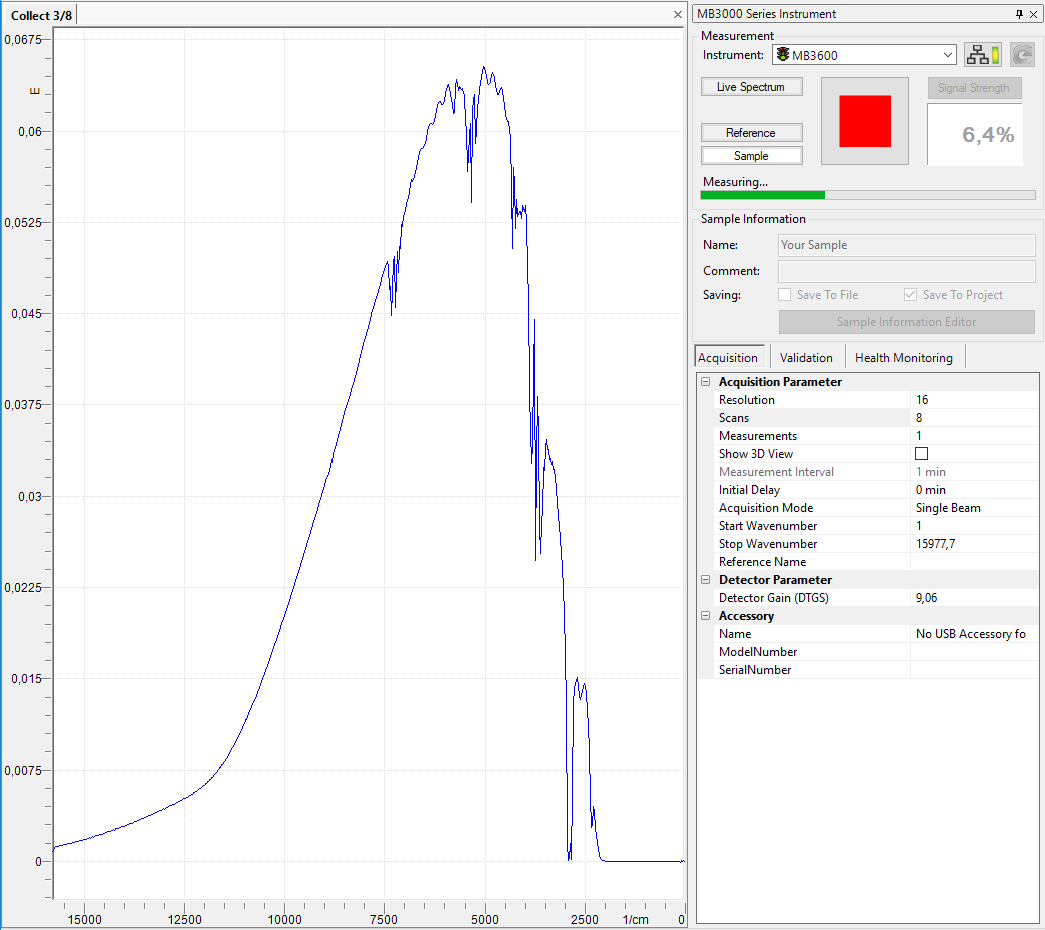
A complete application window looks like this showing a live spectrum measurement in progress:
Spectrum Measurement Window contents
The spectrum measurement window is divided into two parts:
-
Data Display: A regular 2D/3D-View displays the measured data or live spectrum.
-
Instrument Tab: A regular tab (like the project/library tabs in the application) holds all instrument controls and parameters. Please review the section Instrument Tab for a detailed description of all options.
Switching between the different instrument types can easily be done via the Instrument menu. Simply select the appropriate instrument in the menu and the instrument tab will switch to the selected instrument type.
All regular Tab Operations also apply to the instrument tab. In addition to the usual "docked" position the tab may be automatically minimized:

When minimized to the right side of the application window as shown above, you may simply move the mouse over the lettering to make it slide in. Alternatively you can display it as detached floating window on top of the software:
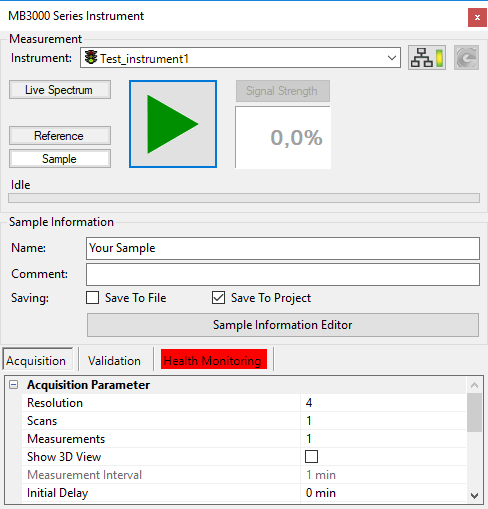
Please review the chapter Tab Operations for details.