Noise Statistics
The Noise Statistics can be calculated for one or more 2D data objects being merged in the same data view. The user may select a spectral range of interest for calculation of the Signal/Noise ratio and additional statistical values. The following statistical values are calculated:
-
Mean
Mean intensity value -
Dp-p
Peak-to-peak deviation -
SNRp-p
Peak-to-peak Signal to Noise ratio -
Dst
Standard Deviation among all intensities -
SNRRMS
Root mean square error of signal to noise ratio
For details on the algorithm, please refer to the "Noise Statistics" section in the chapter "Mathematics".
Noise Statistics Menu Command
To perform the operation using the menu command, please follow the steps below:
-
Open one or more desired 2D data objects to be evaluated.
-
Merge them into one data view.
-
From the Mathematics menu, select the Noise Statistics command.
-
In the Mathematics tab, set the parameter Use Full Range
-
Yes
The full spectral range is used for the calculation. -
No
Only a part of the spectral range, which is limited by the Minimum and Maximum parameters is used for the calculation.Enter Minimum and Maximum value in order to define a spectral range for noise calculation.
Alternatively, move the highlighted plane inside the spectrum view to modify the spectral range to be considered for calculation
- Click the Calculate button.
A new dialog window is opened, which contains a result report with all noise statistics:
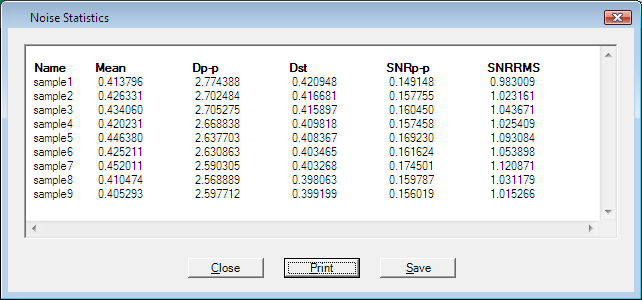
-
Click the Print button to show a print preview of calculated results (Optional).
-
Click the Save button to save a rich text file with results (Optional).
-
Click the Close button to close the dialog.
Noise Statistics Keyboard Shortcut
None.